Message Proxies and benefits
Message proxies are the tools Parasoft virtualized used to record live system behavior and redirect to the desired endpoints (Real or Virtual). Message proxies listen the traffic going via Parasoft Virtualize and on the basis of configuration either redirect to real end points or redirect to virtual asset to send the response defined in configured responder. These proxies can record traffic to emulate the captured behavior—enabling you to cut the dependencies on system components that are difficult to access. They support HTTP/S, JMS, MQ, and internal transports.
To use the message proxies with your Application under test (AUT), it needs to be changed once to point to message proxy instead of real end points. After that, developers, QAs, and Performance Test Engineers can then easily start and stop recording, direct traffic to specific virtual assets, and so on.
There are some other benefits of using message proxies include:
- Configurations are saved and managed like virtual assets, enabling you to reuse settings.
- Using monitoring feature of the tool you can monitor the traffic flowing through proxy.
- Virtualize Server can host (deploy) multiple proxies on various connections and configurations.
- Each proxy can be enabled/disabled individually, which allows JMS and MQ connections to be disconnected so that messages are not consumed by the proxy (similar to Virtual Assets).
- Proxy settings can be managed on both the local Virtualize Server or a remote Virtualize Server via Virtualize Desktop.
- Once you point the application under test to the proxy endpoint(s), you can start/stop recording on demand and modify the target service endpoint where the messages are being forwarded at any time without any impact on the AUT. For example, without touching the AUT, you can redirect messages from an actual service to a virtual asset (and that virtual asset can be hosted on the localhost server or a remote server).
- Multiple proxies can be configured on a single server (similar to Virtual Assets).
If you do not want to use message proxies, you can record traffic using the recording proxies discussed in upcoming topics.
Creating Proxies
To create the message proxy look over at the Virtualize server view on the right pane. Here, if you expand the server tab, you should see your “local machine” server. If it is not already, expand this as well. At that point, the “Message Proxies” folder will be visible.
- In the Virtualize Server tree, right-click the server where you want the proxy deployed (Local machine or a remote server), then choose Add Message Proxy.

A new Proxy node will be added under the Message Proxies folder (which will be created if not already present). The added proxy will be initially be set to a disabled state.
- Double-click the added node to open its configuration panel. In the General tab, rename the proxy and (optionally) enter a description for it.
- Open the Connections tab. On this screen, you can view any active proxies that were created as part of this proxy “container”. This is where you specify at what endpoints you want the proxy to listen for messages and where you want it to direct the received messages.
- Next we will want to add our connection settings. These settings will be different for every service, so make sure that you are double-checking these settings as they are being input. The first connection you will make is from the incoming client. This setting should be something that is easily identifiable as being the proxy, so it is considered best practice to make this incoming path the same path as the connection to the service that you are trying to emulate, but add in “/proxy/” to the beginning of it. For each endpoint you want to use the proxy, do the following:
- Click Add.
- Select the appropriate transport type.
- Complete the proxy settings. Please see examples below in same tutorial topic.
- In the Traffic file field, specify where you want to save the traffic data that will be captured when the proxy is set to record mode. You can later use this traffic file to generate virtual assets that represent the live traffic captured in record mode.
i. By default, traffic will be recorded in a file named %n_%d_%t.txt (<proxy_name>_<current_date>_<current_time>.txt). It will be stored within the recorded_traffic folder (this will be created if it does not exist). You can modify the file name, but not the folder. The folder is always located within the VirtualAssets project.
ii. When specifying the file name, you can use variables such as %d (current date) %t (current time), %n (proxy name), and %u (unique time-based id). Wildcards can be used together and mixed in with the name. For example, you could use %nProxyTraffic%d or %u_%d%nTraffic
iii. Do not configure multiple proxy connections to write to the same traffic file at the same time. This could corrupt the traffic file. - In the Recording Session area, specify how you want traffic data recorded in traffic files:
i. Append new session data adds new traffic data to an existing traffic file (the one specified in the Traffic file field). If the specified file does not already exist, a new file will be created. See More on Recording Session Options below for additional details.
ii. Overwrite session data overwrites the traffic data in an existing traffic file (the one specified in the Traffic file field). If the specified file does not already exist, a new file will be created. See More on Recording Session Options below for additional details.
iii. New session file for each message pair (HTTP and internal only) creates a separate traffic file for each request/response pair. See More on Recording Session Options below for additional details.
- Click OK.
Preventing Infinite Loops
If your proxies and/or Message Forward tools inadvertently set up a forwarding cycle like A> B> C> A, this could result in an infinite loop. To prevent such loops, Virtualize is configured to stop forwarding after 10 hops. You can change this by setting the system property parasoft.proxy.loop.max.limit (e.g., parasoft.proxy.loop.max.limit=5).
Note that this loop detection applies only to internally-routed forwarding (e.g., it applies to routing to localhost, not routing to a host name).
Example: Sending Traffic to a Service
Assume that we want to create a message for a service that is normally accessed at http://example.parasoft.com:9080/BookStore. We could create an HTTP proxy with the settings:
- Proxy listen path: /BookStore
- Service host: example.parasoft.com
- Service port: 9080
- Service forward path: [empty]
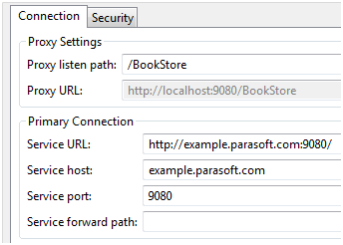
This configuration will listen on /BookStore and forward all traffic to the actual book store service. If we wanted to listen on a path other than the service path, we would configure the proxy as follows:
- Service forward path: /BookStore
- Proxy listen path: /SomeOtherPath
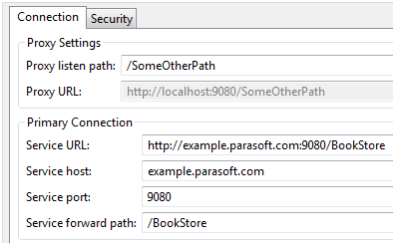
This would route traffic from /SomeOtherPath on the proxy to the actual book store service. In both cases, all traffic that goes to those paths (including sub paths) is sent to the service. In the secondexample, traffic sent to /SomeOtherPath/SubPath would be sent to /BookStore/SubPath. Since
queries are preserved, /SomeOtherPath?param=value would be sent to /BookStore?param=value.
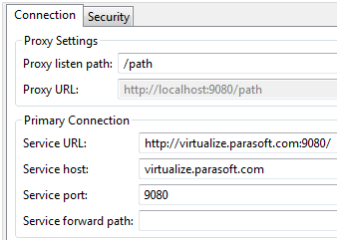
Example: Sending Traffic to a Virtual Asset
A proxy can also send traffic to a virtual asset. In that case, enter the host and port information for the Virtualize Server as if were just another service. For example, to send traffic to a virtual asset on a remote server, you might use:
- Service host: virtualize.parasoft.com
- Service port: 9080
- Proxy listen path: /path
To send traffic to a virtual asset on a local server, you might use:
- Service host: localhost
- Service port: 9080
- Service forward path: /pva
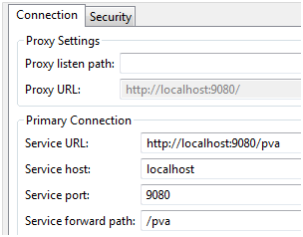
The HTTP proxy makes no distinction between a virtual asset and an actual service. Both are configured the same way. However if the HTTP proxy is sending to localhost, you must specify Service forward path because the proxy doesn’t allow forwarding to itself.
Enabling/Disabling Proxies
As we saw when create the proxy in disable state. Here we will explain how to enable and disable proxies from the Virtualize UI.
Enabling a Proxy
When a proxy is enabled, it will forward traffic in the configured manner. You can also record from it as well as monitor its events. There are two ways to enable a proxy:
- In the Virtualize Server tree, right-click the appropriate proxy, then choose Enable.
- In the proxy’s configuration panel, click Enable Proxy.

Once enabled, the proxy’s icon will change from gray to color.
Disabling a Proxy
As we saw for steps for enableing the proxy, similarly there are two ways to disable a proxy:
- In the Virtualize Server tree, right-click the appropriate proxy, then choose Disable.
- In the proxy’s configuration panel, click Disable Proxy.
Event Monitoring using proxies
Enabling the Event Monitoring
By default, Parasoft Virtualize is configured to log and report the events related to a Virtualize Server. To view and modify event monitoring settings:
- Start Virtualize Server in GUI mode.
- In that GUI, open the configuration panel for the server you want visibility into (double-click its Virtualize Server view node).
- In the Server Configuration tab, review and modify the available options:
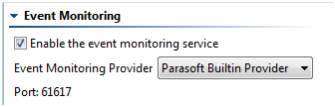 a. Enable the event monitoring service: Enables/disables event monitoring for this server. Event monitoring is enabled by default.
b. Event Monitoring Provider: Specifies the provider that the event monitoring service uses. By default, a built-in provider based on ActiveMQ is used. To use another provider, select it from the list of available options, then complete the applicable fields.
c. Port: The service’s port number is automatically assigned based on the system’s port availability.
Starting Event Monitoring
To indicate that you want Virtualize to start reporting the events related to a virtual asset or message proxy, do one of the following:
- Right-click the asset or proxy in the Virtualize Server view, then choose Start Monitoring.
- In the proxy’s/asset’s configuration panel, click Start Monitoring.
Starting Event Monitoring
To indicate that you want Virtualize to stop reporting the events related to a virtual asset or message proxy, do one of the following:
- Right-click the asset or proxy in the Virtualize Server view, then choose Stop Monitoring.
- In the proxy’s/asset’s configuration panel, click Stop Monitoring.
Viewing and Exploring Events
The Parasoft Event Details perspective is designed to help you view and explore events that occur on the Virtualize Server (request messages received, response messages sent, errors, and so forth). You can open this perspective in any of the following ways:
- Click the Parasoft Event Details button in the shortcut bar (on the top right of the workbench).
- Click the Open Perspective button in the shortcut bar, choose Other, then choose Parasoft Event Details in the Select Perspective dialog that opens.
- Choose Window> Open Perspective> Other, then choose Parasoft Event Details in the Select Perspective dialog that opens.
Reviewing Message Proxy Events
Viewing the events generated when messages flow through a deployed message proxy helps you understand what traffic the application under test is sending through the message proxy. Generally, every request/response message pair that travels through a message proxy will generate the following events:
Request received: Indicates a message received by a message proxy. Provides details on the HTTP path or queue name where the message was received, the Virtualize server host name, and the message. See more details about an event Select the related event in the Event Log view Clear the current information and start a new Session Click the Start New Log button Review one of the 5 most recent logs Choose the appropriate log from the Event Log’s History drop-down menu
Proxy request sent: Indicates that the proxy has forwarded the message to its intended target service destination. Details include the destination and the message contents.
Proxy response received: Indicates that the proxy has received a response from the target service.
Response sent: Indicates that the proxy has forwarded the response received from the service to the original caller (the AUT).
